Collecting and using data to gain insights into care processes and the patients we serve is still relatively new in the health care industry. Whereas other types of businesses have been doing this for years to better understand their customers’ wants and needs. With that, health care systems have had to devise strategies  around the type of data they wanted to collect, where to store it and how to effectively use it to employ best practices, improve patient outcomes and decrease costs.
OSF HealthCare has been ahead of the pack when it comes to collecting, curating and utilizing data to improve care. In 2013, we formed the Healthcare Analytics department, a part of OSF Innovation, to facilitate and energize the translation of this data into actionable insights. This includes building tools to make it easier for health care executives, managers and providers to pull and distill complex data to make informed decisions about everything from patient care to developing best practices for clinicians to provide consistent, high levels of care.
Two of the most frequently used tools within the health care organization are called Dashboards and Explorers. Both formats were built with the capability to display updated data on a daily and weekly basis.
Data in Dashboards vs Explorers
The data collected and displayed within our Dashboards are typically a higher level overview of targets the health care system wants to meet. That includes goals for how we are performing as a whole, how individual hospitals and medical groups within the Ministry are operating and how we stack up against similar hospitals outside of OSF. For example, OSF continually updates the patient experience score, so facilities know whether the health care organization is meeting its goal to provide the best care possible.
Explorers give users the opportunity to dig a little bit deeper into the information they want to see, so they can spot trends and opportunities. If someone wants to learn why our patient experience score is higher or lower than expected at a certain hospital or physician’s office, she would utilize an Explorer to find data on how nurses and physicians are performing at that particular site.
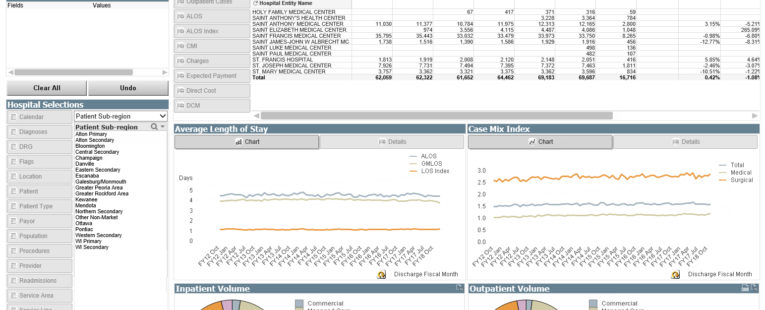
Explorers can also help users see trends among our patients. Our Enterprise Explorer has information about every billed encounter within OSF which includes all patients, diagnoses, procedures, providers, financials and lengths of stay. It then lets you narrow your focus further by geography, facility, type of disease and type of procedure. This Explorer has up to 700 different fields of data in it.
Why Does Data Matter?
As health care delivery continues to move in the direction of population health management, it’s imperative for providers to understand the health of the patients they serve and what’s needed to ensure a healthy community. Having data at their fingertips helps them see where they are lacking and take action to improve the quality of care they provide.
The trick is organizing that data into an easily digestible format which the Healthcare Analytics team strives to do. It’s the work of our team that helps leaders, managers and providers make informed decisions to make actionable improvements that impact patient lives, outcomes and financial stability.
Last Updated: April 26, 2018