Consumer Information
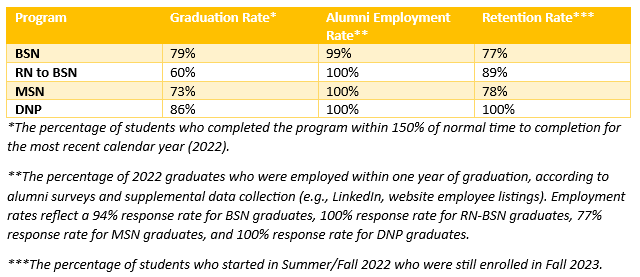
In compliance with The Student Right to Know Act, the BSN graduation, completion, retention rates and employment rates are as follows by percentage:
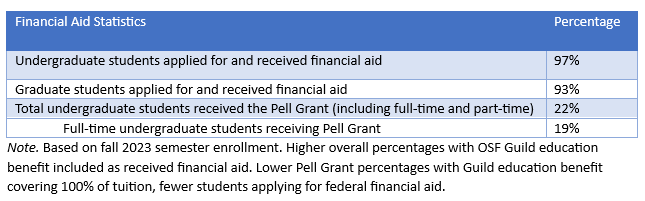
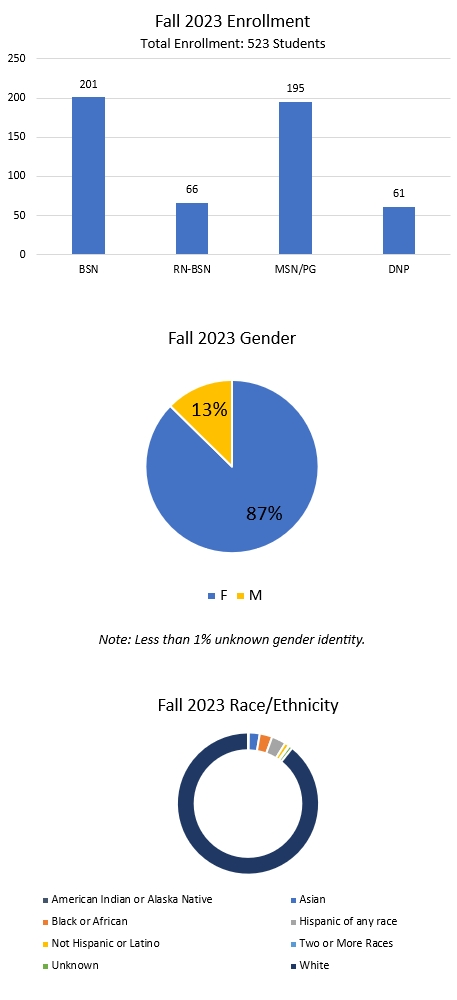
Quick Facts
Student Information
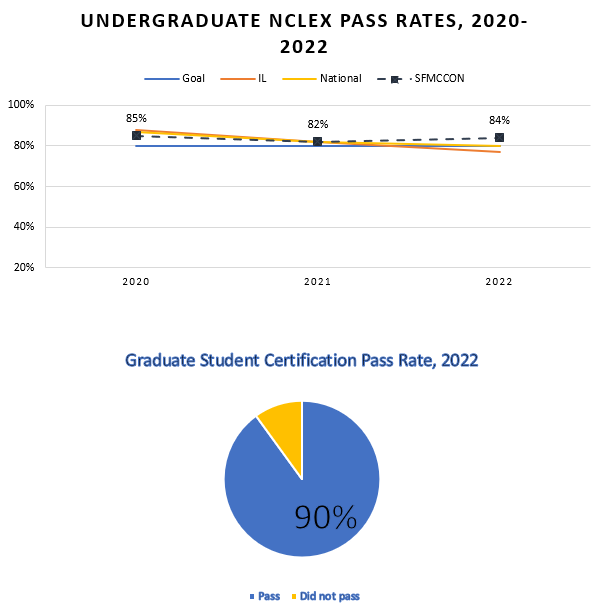
Licensure and Board Pass Rates
SFMC-CON Curriculum for Licensure in Other States
Complaints
Students may file complaints with the Illinois Board of Higher Education through the IBHE website or contacting the Board at:
Illinois Board of Higher Education
1 North Old State Capital Plaza, Suite 333
Springfield, Illinois 62701-1377
Safety & Security
- Alcohol and Drug Abuse Policy
- 2023 ASR and Fire Safety Report (PDF - 1.2 MB)
- Emergency Operations Plan (PDF - 3.8 MB)
- Right-to-Know/Campus Crime Requirements (PDF - 307.3 KB)